Comparison: 2022 Migration Rates to 10-year Average Rates
The graphs below compare the 2022 migration rates to the 10-year average rates for the four most
numerous raptor species seen at the Golden Gate: Sharp-shinned and Cooper’s Hawks, Red-tailed
Hawks, and Turkey Vultures. These four account for roughly 87% of the sightings in a single autumn. Additionally, these four largely define how we perceive the magnitude of the migration each year.

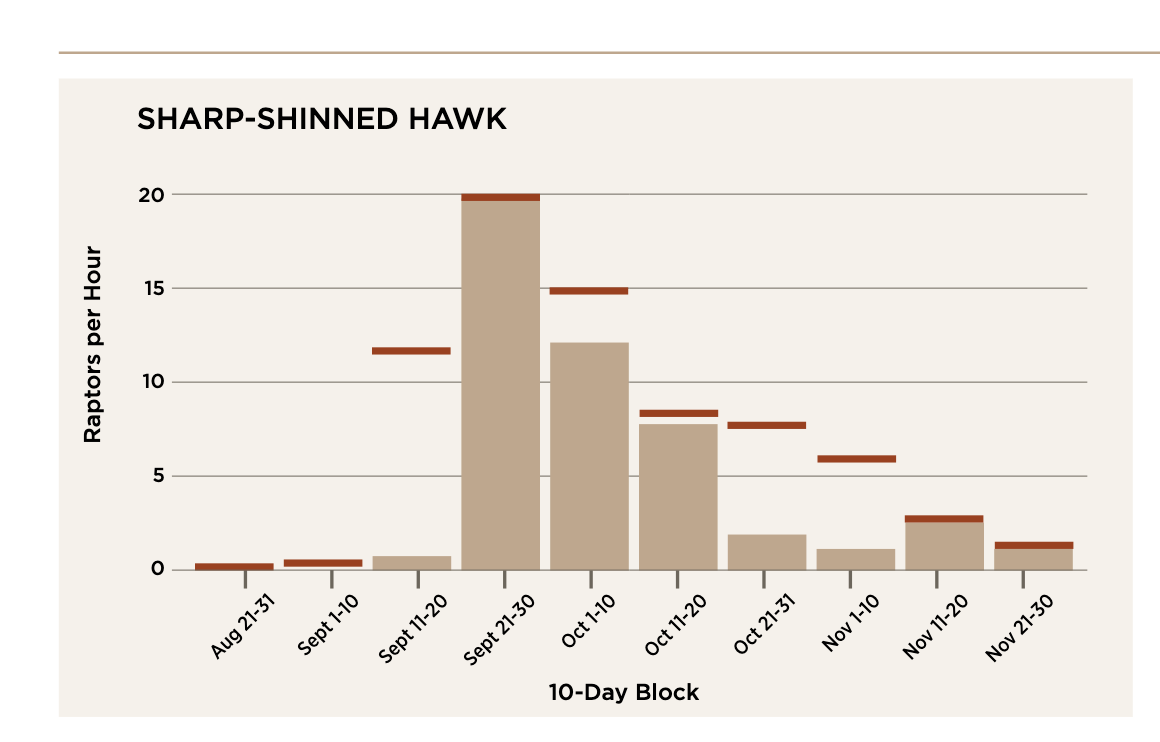
The 2022 flight was defined by the lack of Sharp-shinned Hawk sightings in mid-September. For that middle week of September, the average flight is 7 Sharpshins per hour over Hawk Hill. In 2022, we barely touched one hawk per hour. By late September 2022, the
Sharpshin peak was solid, just matching an average year, but by late October their rate fell off again. We made these graphs to specifically show the phases within a fall migration for each species. For accipiters (Sharp-shinned and Cooper’s Hawks), we see a quick and dramatic rise to a late September peak, followed by a shallow decline, almost a plateau of strong migration, until mid-November when there’s a more dramatic drop. For Red-tailed Hawks and Turkey Vultures, the migration is more constant through the fall, with a noticeable peak in vultures in early October, and two peaks for Redtails, mid-September and mid-November. Also notice the difference in the vertical axes between these species—the magnitude of change this year is different for each. We have dropped 2010, 2013, and 2020 from all the 10-year averages, since the counts from those years were affected by unforeseen circumstances.